Introduction
An experiment was conducted to challenge and observe the theory of Hooke’s Law, which states that a material’s strain properties are directly proportional to the stress that is put upon it. For this experiment, three unknown materials were tested, put under various quantities of stress (force in newtons) and their reactions were analysed. The first two sets of results, (y1 and y2) were known to be in their linear regions, where Hooke’s Law still applies; this is unlike the results for z, which was known to be past it’s elastic region, offering alternative properties to observe.
Methodology
One of the three materials were anchored at one point and pulled at the other, being submitted to various quantities of force, starting from 1 newton, increasing with increments of 1, ending at 9 newtons. An extension of the material was induced, measured and recorded. To find the values of extension for y2 and z, known equations and constants were used alongside the x and y1 results.
Results
Now onto the interesting part! Values of y1 were recorded from the experimental process, whilst values of y2 were calculated with the known equation y2=(a+0.5)x+c where c=0.2, a known value, and a is a constant found in y1=ax+b. Furthermore, the only currently unknown value is a, which can be easily determines with the use of a graph and trend line of the results from y1.
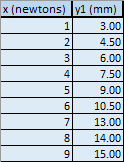
Firstly, values of x and y1 were tabulated.
Then, a scatter graph was plotted to review these results

As shown in the image, values of a and b were determined by evaluating the properties of the trend line. These values were found to be 1.5583 and 1.375 respectively. The value of a is used to calculate y2 values, and the value of b is used to calculate values of z. The value of c was already known to be 0.2.

Since, as previously stated, the value of a is now known, values of y2 against x can be calculated. The equation was y2=(a+0.5)+c.
Additionally, values of z can be found with the equation z=x^3+b. These newfound values are tabulated here:

With all of this data, a clear display of what it represents can be obtained via visualisation with graphing; this was the next step.
Since y1 and y2 have similar ranges, they could share the same graph.

It was interesting to observe that there was an overlap between the lines of y1 and y2, indicating that at a certain x value, they both possess the same elastic properties. Firstly an estimate of the force was made, of 2.3 newtons, and then a calculation was conducted to find the true value of 2.35.


When analysing the two linear relationships, the most immediate thing that comes to mind is the difference in gradient. This value is important as it indicates exactly what the Young’s Modulus of the material is. Young’s Modulus is defined as the tensile stress of a material divided by the tensile strain. Or, in simpler terms, how much a material will extend and stretch when a tensile force is emitted upon it.
The gradient of y1 is known to be 1.5583 and y2 2.0583. This means that y2 is less resilient to stress, extending more than y1 would under the same tensile stress.
In the results of y1, a trend line is present to represent the lineal relationship between force and extension, however this trend line is not completely consistent across all data points. This indicates an error in either the experimental procedure or the assumptions made from analysis. Assuming Hooke’s Theory is true (which is a fair assumption) this data does not follow the conditions if the material is within the plastic region. This could suggest that the data is fairly accurate and is recorded passing over the plastic region limit.
Since the extension values for z were too high for clear comparison, it was produced on a different graph.

This second graph displays values of z against x. Unlike the previous two, this line is a polynomial.
According to Hooke’s Law, a materials strain should be directly proportional to the stress applied, unless the plastic limit has been passed. The relationship between z and x indicate that the elastic limit has indeed been passed.
When applying stress starting from 0 newtons, it can be seen that the material relatively slowly extends, but as the force higher, the extension grows relatively quicker. In other words, the gradient is significantly lower for lower values of force, and vise versa. Physically, the more force the material is exposed to, the less resilient it will be per unit of force.
Conclusion
As a summary, three sets of data was collected, tabulated and graphed to show relationships between force and extension for three different materials. The motivation for this experiment was to challenge Hooke’s Law, analysing how the three selected materials fit in with the established rules.
From the collected data, materials inside and outside the elastic limit were found, presenting different relationships between stress and strain. There were no opposing results to Hooke’s Law, so as far as this experiment has the right to, Hooke’s Law is confirmed to be applicable to the three materials tested.
